Manager
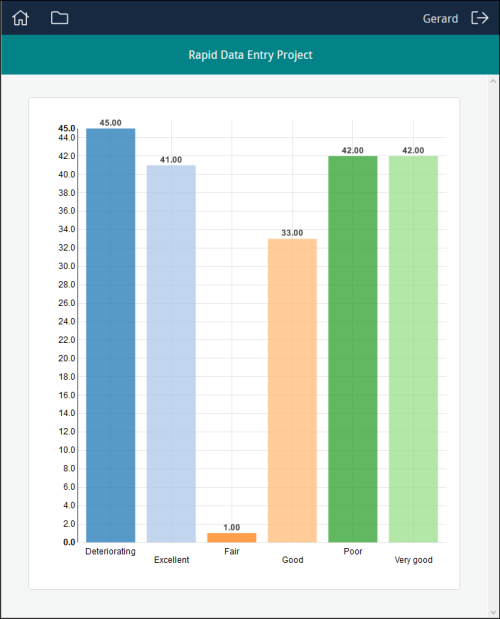
Authorized users (Managers) can be provided with graphs (bar and pie) presenting any sort of statistical data. (the progress of a project, the condition of objects, etc.). This example presents the condition of objects as a bar graph:
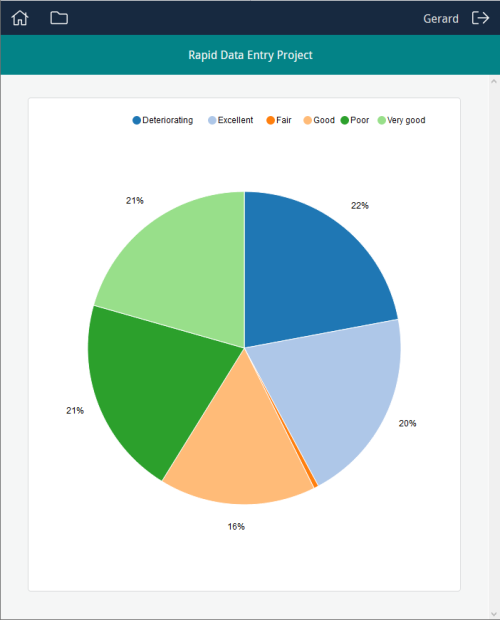
The pie chart depicts the same results as a percentage:
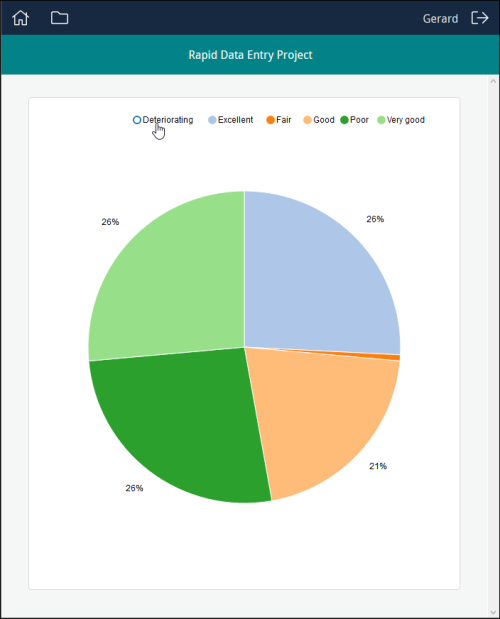
The pie chart is interactive. Clicking an entry in the Legend above the chart (Deteriorating in this example), removes the entry from the graph and recalculates the percentages of the remaining entries:


